---
title: "Serving, Deployment, and Monitoring"
subtitle: "Latency, throughput, batching, caching, observability, and drift"
---
## Chapter orientation
A trained model becomes a service only when requests can be admitted, processed, observed, and recovered under a declared reliability and cost budget. Model quality measured offline is one component of that system. Prompt length, batching, queueing, decoding, cache policy, hardware, fallbacks, and user traffic determine what a deployment delivers. The dependence of model behaviour on surrounding technical systems is a central source of accumulated machine-learning technical debt [@sculley2015].
::: {.concept-box .concept-core #concept-serving-system data-term="Serving system" data-domain="Modern AI systems"}
**Serving system.** The operational path that admits, queues, processes, checks, returns, and records model requests. Latency, throughput, caching, routing, fallbacks, and monitoring determine delivered behaviour.
:::
::: {.concept-box .concept-distinction #concept-model-service data-term="Model behaviour and service behaviour" data-domain="Modern AI systems"}
**Model behaviour and service behaviour.** Model behaviour concerns outputs from a declared model interface. Service behaviour also includes queueing, batching, caching, tools, policies, traffic, and recovery. An offline model result does not establish an operational result.
:::
## Level 1 - A request has a lifecycle
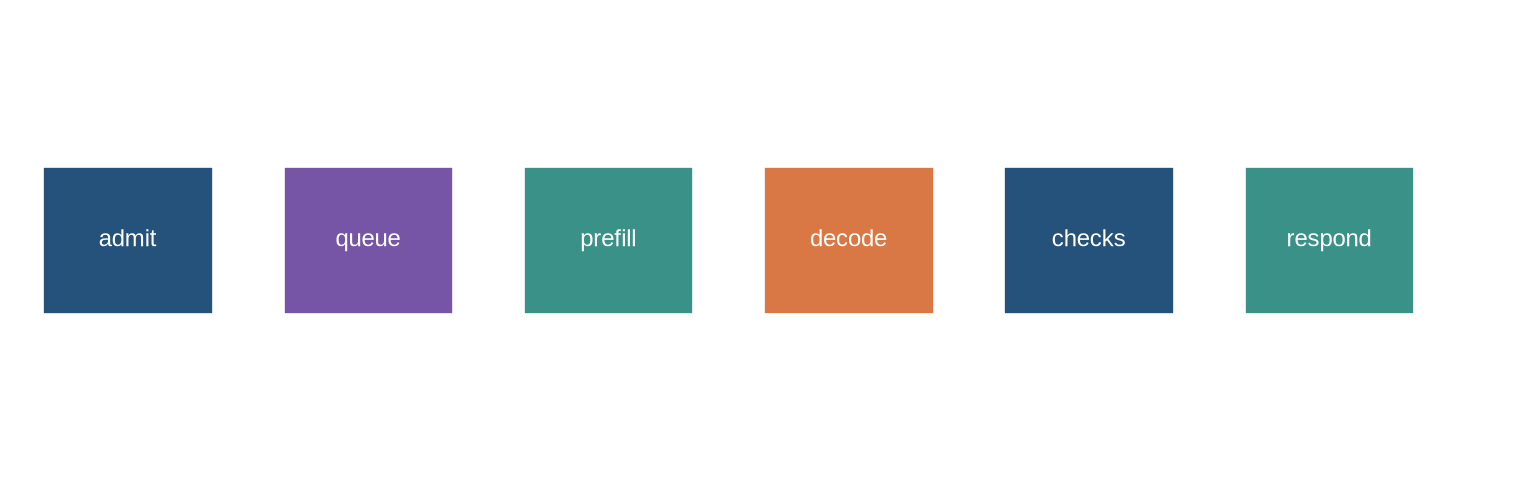
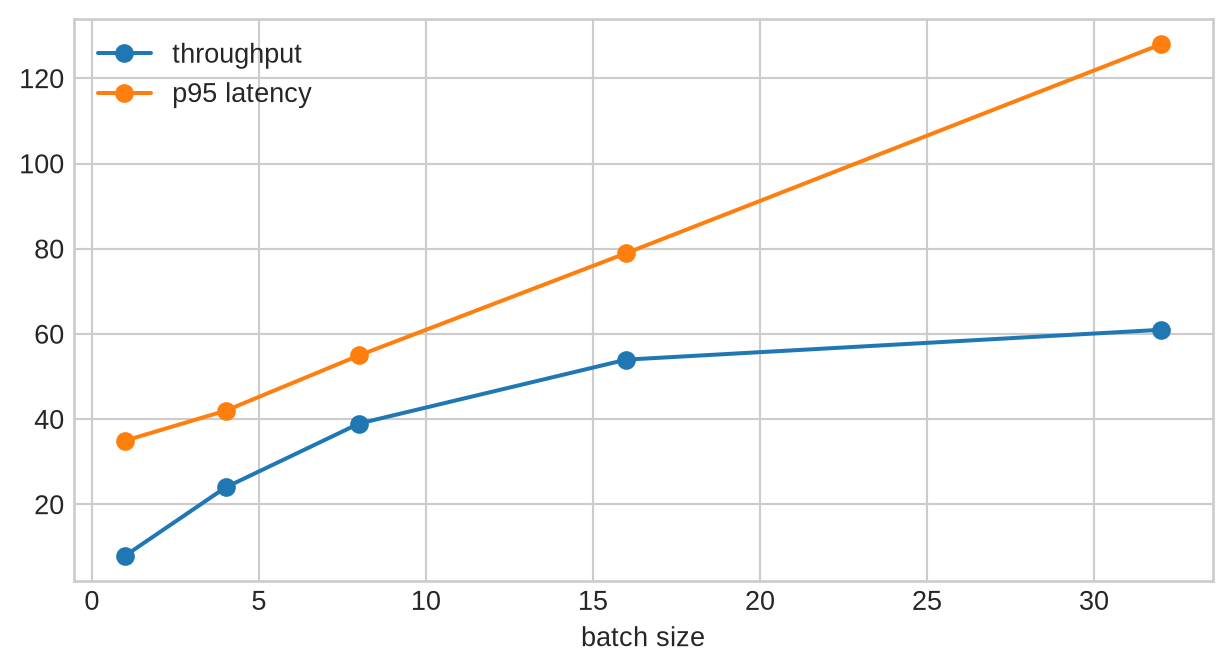
A request is validated, queued, prefixed through the model, decoded token by token, checked against policy or tool constraints where relevant, and returned with a record. Latency includes waiting as well as model execution. Throughput is the number of completed requests over time. Improving one can worsen the other: larger batches often raise throughput while delaying individual requests.
```{python}
#| label: fig-request-lifecycle
#| fig-cap: "A deployed model request passes through admission, queueing, prefill, decoding, checks, response, and an observability record."
#| fig-alt: "A sequence of boxes shows the request lifecycle from admission to response, with monitoring attached to each stage."
import matplotlib.pyplot as plt
from matplotlib.patches import Rectangle
plt.style.use("seaborn-v0_8-whitegrid")
fig,ax=plt.subplots(figsize=(10,3));ax.axis("off")
for i,(l,c) in enumerate([("admit","#24527a"),("queue","#7655a6"),("prefill","#3a9188"),("decode","#d97745"),("checks","#24527a"),("respond","#3a9188")]):
 x=.15+i*1.55;ax.add_patch(Rectangle((x,1),1.1,.5,facecolor=c,edgecolor="white"));ax.text(x+.55,1.25,l,ha="center",va="center",color="white",fontsize=9)
ax.set_xlim(0,9.6);ax.set_ylim(.5,2);plt.show()
```
## Level 2 - Batching and caching change the cost model
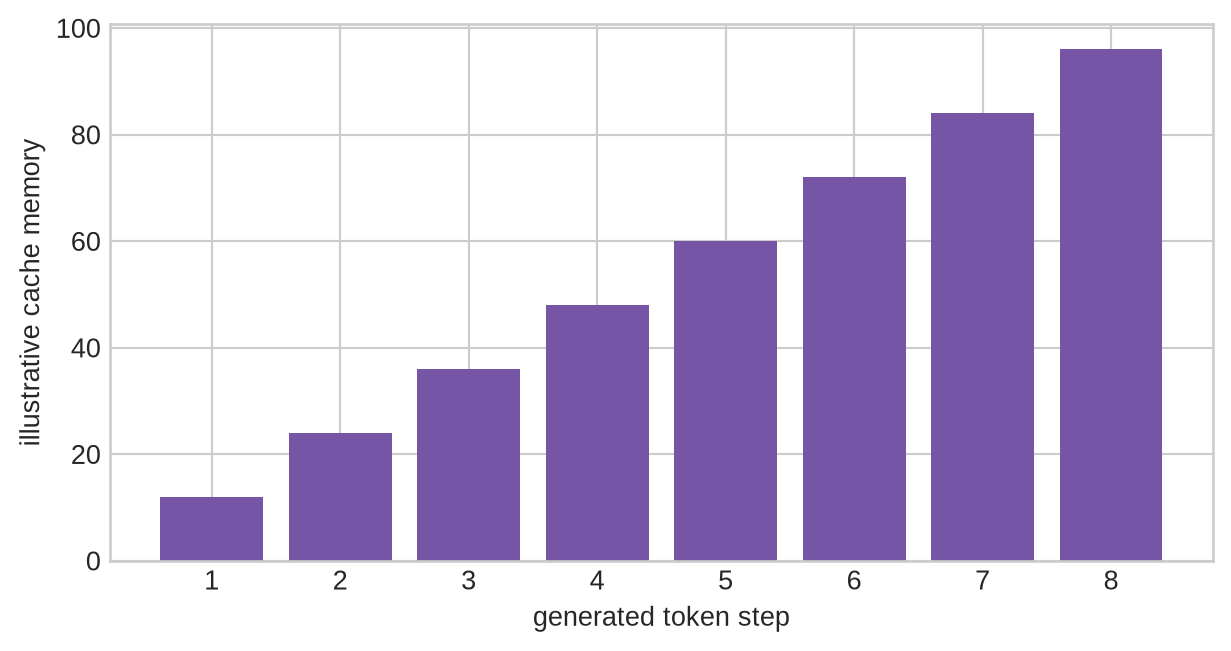
Prefill processes the prompt context; decoding produces later tokens sequentially. Continuous batching can combine requests at different stages, raising hardware utilisation while making queue policy part of latency. A key-value cache retains attention keys and values for prior tokens, avoiding repeated work during decoding. It consumes memory proportional to active sequences, layers, hidden dimensions, and context length. Cache eviction or truncation changes what the model can condition on.
Admission control decides which requests enter the system when capacity is scarce. A service may limit prompt length, generated tokens, concurrent tool calls, or per-user rate; it may prioritise one workflow over another. These are policy decisions with quality consequences. A rejected request, a truncated context, and a degraded fallback response should be counted separately in service reporting.
Caching also has correctness boundaries. Reusing a prefix cache is appropriate only when the model version, tokenizer, system prompt, and cached tokens match the current request. Reuse across users or security contexts can expose data. Record cache key design, isolation rules, hit rate, eviction cause, and the effect of cache pressure on latency.
Token budgets are another admission decision. A system can truncate a long prompt, reserve space for output, summarise earlier context, reject the request, or route it to a larger-context model. These responses are not equivalent: truncation can remove evidence, summarisation can introduce an unverified representation, and a rejection can be the safest result. Log the selected policy and the fraction of requests affected so that an apparent quality or latency change is not attributed solely to the model.
Capacity planning should use arrival patterns rather than average traffic alone. Short bursts can create a queue even when mean utilisation appears moderate. A production record needs concurrency, request-length distribution, batch policy, accelerator allocation, timeout rate, and tail latency. These fields identify whether a regression came from model decoding, long prompts, a traffic change, or insufficient capacity.
### Queue policy distributes a scarce resource
Requests may be processed in arrival order, grouped by length, prioritised by workflow, or limited by user and tenant quotas. Each policy changes who waits and whose context is truncated or rejected under load. A short-request preference can improve aggregate latency while delaying long-document work; a priority lane can protect a high-consequence workflow while reducing capacity for others. State these choices and measure their effects by request class.
Retries require the same care. Retrying a failed generation can improve completion rates, but retries also increase load and can duplicate a consequential tool action. Use idempotency keys for actions, cap retry budgets, distinguish transient infrastructure failures from policy refusals, and record whether the retry changed prompt, model, tool state, or user-visible result.
```{python}
requests=[{"class":"interactive","queue_ms":18,"completed":True},{"class":"long-context","queue_ms":140,"completed":True},{"class":"tool-action","queue_ms":31,"completed":False}]
for request in requests: print(request)
```
```{python}
#| label: fig-batching-tradeoff
#| fig-cap: "Larger batches can raise throughput while queueing and tail latency increase; the selected policy should be evaluated against both measures."
#| fig-alt: "Two lines show throughput increasing and p95 latency increasing as batch size grows."
import numpy as np
b=np.array([1,4,8,16,32]);fig,ax=plt.subplots(figsize=(6.5,3.6));ax.plot(b,[8,24,39,54,61],marker="o",label="throughput");ax.plot(b,[35,42,55,79,128],marker="o",label="p95 latency");ax.legend();ax.set_xlabel("batch size");plt.tight_layout();plt.show()
```
```{python}
record={"prompt_tokens":900,"generated_tokens":120,"prefill_ms":180,"decode_ms":410,"queue_ms":35}
print("end-to-end latency",sum(v for k,v in record.items() if k.endswith("_ms")))
```
```{python}
#| label: fig-kv-cache
#| fig-cap: "A key-value cache avoids recomputing prior attention states during decoding but grows with active sequence length and concurrency."
#| fig-alt: "A growing token sequence points to an expanding cache memory bar during successive decoding steps."
steps=np.arange(1,9);fig,ax=plt.subplots(figsize=(6.5,3.5));ax.bar(steps,steps*12,color="#7655a6");ax.set_xlabel("generated token step");ax.set_ylabel("illustrative cache memory");plt.tight_layout();plt.show()
```
## Level 3 - Deployment is an experiment with safeguards
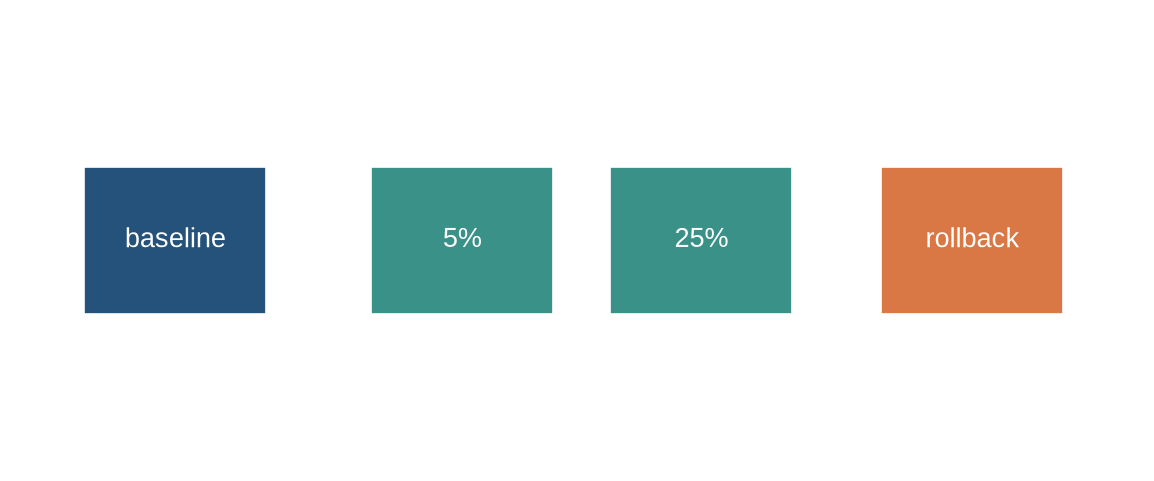
Release policies should define model and prompt versions, traffic allocation, fallback model, timeout, rate limit, tool permissions, and rollback criteria. An offline evaluation set cannot represent every live request. Staged release can compare a candidate against a baseline under matched traffic, while protecting users from known failure modes. Logging requires a retention, access, and redaction policy; observability is not authorisation to retain raw user data.
A comparison requires a denominator. Report the eligible traffic population, assignment rule, exclusions, sample size, time window, and whether users can retry into another arm. Compare quality, safety, cost, and latency jointly; a candidate that reduces average latency by refusing more requests or routing difficult inputs to a baseline has not established a general operational improvement. For consequential workflows, define a human-review route before exposure rather than after an incident.
```{python}
#| label: fig-staged-release
#| fig-cap: "A staged release sends a measured share of eligible traffic to a candidate model while retaining a baseline, safeguards, and rollback decision."
#| fig-alt: "Traffic flows first to a baseline and then in increasing small shares to a candidate, with a rollback arrow."
fig,ax=plt.subplots(figsize=(7.5,3));ax.axis("off")
for x,l,c in [(.4,"baseline","#24527a"),(2.2,"5%","#3a9188"),(3.7,"25%","#3a9188"),(5.4,"rollback","#d97745")]:ax.add_patch(Rectangle((x,1),1.15,.5,facecolor=c,edgecolor="white"));ax.text(x+.58,1.25,l,ha="center",va="center",color="white")
ax.set_xlim(0,7);ax.set_ylim(.5,2);plt.show()
```
## Level 4 - Monitor system and outcome signals
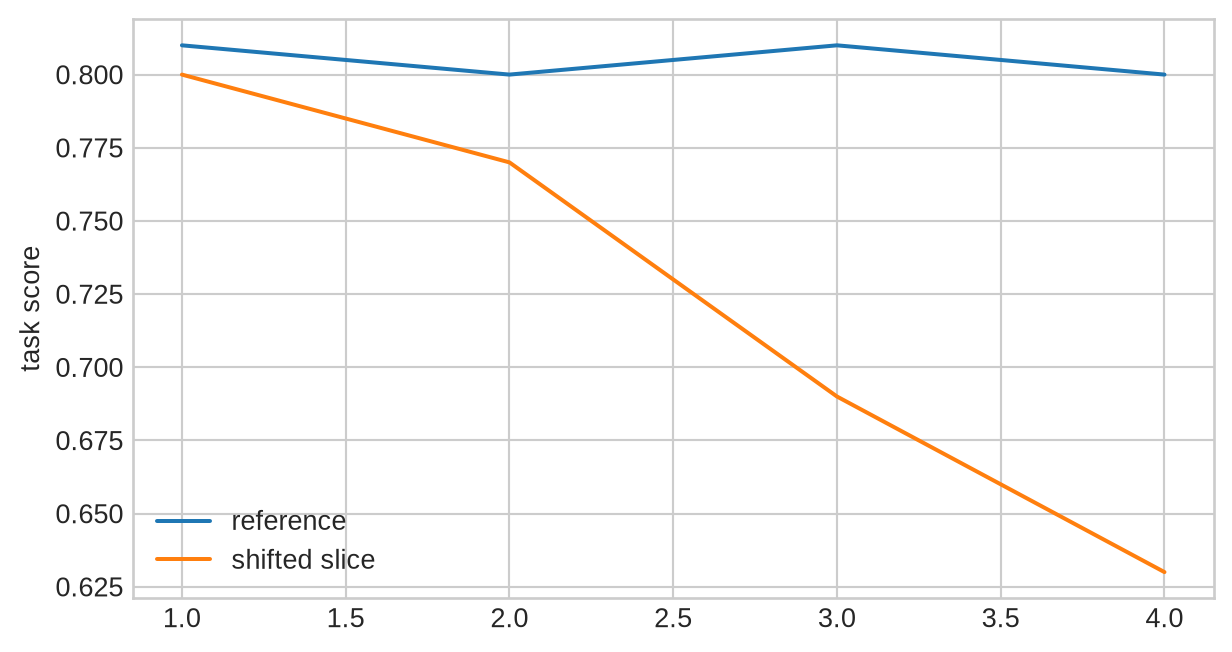
Monitor availability, errors, queue time, prefill and decoding latency, token counts, cache pressure, cost, refusals, tool failures, and fallback rates. These describe service behaviour. Monitor outcome quality separately through sampled review, user feedback with known selection bias, task-specific checks, and recurring held-out tests. Drift can arise from a changed request population, new documents in retrieval, altered tool behaviour, policy changes, or a model update.
An alert should name an owner and a response. A p95-latency increase may require capacity adjustment; a rise in tool failures may require disabling a connector; a measured quality regression may require rollback or a narrower eligibility rule. Monitoring without a threshold, decision authority, and incident record produces dashboards without operational control.
Separate product metrics from validity evidence. A fall in abandonment may reflect faster answers, but it may also reflect a misleading interface or users who cannot identify an error. Retain independent checks for the task property the service is meant to support.
Drift investigation should begin with a traceable change. Compare model and prompt versions, retrieval index and tool versions, request-length distribution, language and task slices, and any policy or interface change. The response may be to correct a data source, adjust an eligibility rule, disable a tool, retrain a component, or roll back. A dashboard cannot decide among these actions without the record that connects an alert to the deployment configuration.
Incident exercises should test the recovery path. Simulate a dependency outage, runaway queue, cache exhaustion, malformed tool output, and a measured quality regression. Confirm who receives the alert, who can change traffic, what user communication is required, and how the regression test prevents recurrence. These are properties of the operated system, not of the model checkpoint alone.
### State and versioning determine reproducibility
A deployed answer depends on more than model weights. Preserve the model and tokenizer version, system and user prompt templates, retrieval index and corpus version, tool schemas, policy configuration, decoding settings, cache and batching policy, and deployment region or hardware class where it materially affects behaviour. When an incident occurs, this record permits replay or bounded reconstruction without retaining more user data than the retention policy allows.
Recovery should also be tested for partial failure. A tool may finish after the model times out; a client may disconnect after an action was submitted; a new deployment may receive traffic while an old cache remains warm. Define the authoritative state, the reconciliation procedure, and the user-facing status in each case. These details prevent a service from turning an infrastructure fault into an untraceable model error.
### Measure latency as a distribution, not one number
An average response time can be compatible with an unacceptable experience for a minority of requests. Long prompts may take longer to prefill; long outputs may occupy a decoder slot; tool calls may pause a response; and requests arriving during a burst may wait in a queue. Report median, p95, p99, timeout, and cancellation rates, together with the prompt-length, output-length, and request-class distributions. A service that looks fast on short prompts can be unusable for the document workflow it was intended to support.
Break the end-to-end trace into admission, queueing, prefill, decoding, retrieval, tool execution, safety checks, network transfer, and client rendering where the boundary is observable. The purpose is diagnosis. A rising p95 may originate in a new model, cache pressure, an index rebuild, a connector, or traffic composition. Without component traces, a team can make a costly model change to solve a queueing problem.
```{python}
latency_trace={"admission_ms":2,"queue_ms":47,"prefill_ms":210,"decode_ms":380,
               "tool_ms":0,"checks_ms":9,"network_ms":18}
print("end-to-end ms:",sum(latency_trace.values()))
```
### Throughput depends on scheduling and fairness
Throughput is not simply a property of the model. It depends on concurrent requests, batch construction, memory reservation, scheduler policy, hardware topology, cache state, and the output lengths requested by users. Continuous batching can improve utilisation by inserting new work while existing sequences decode, but it can also make the timing of one request depend on others. State the scheduler policy and test it under realistic arrival patterns rather than a uniform synthetic load alone.
Fairness in serving is operational. A length-aware queue can protect short interactive requests while delaying long-context requests. A tenant quota can stop one client from exhausting capacity while making a high-volume legitimate workflow slower. A priority lane can protect an emergency task but requires an eligibility rule and audit record. Report latency, rejection, truncation, and fallback rates by request class so that efficiency improvements do not hide uneven service.
### Caches require both a performance and a data policy
The key-value cache is a model-state optimisation during autoregressive decoding. A prefix cache can additionally reuse an identical initial context across requests. Both save work only under strict identity and isolation conditions. The key must bind the correct model and tokenizer versions, system prompt, retrieved context where applicable, and permission context. It must not permit one user's context to become another user's starting state.
Cache policies should describe what is stored, where, for how long, who can access it, and what triggers eviction. Memory pressure can cause queueing, an out-of-memory error, truncation, or a lower-concurrency mode. Test these paths. A cache hit rate is not sufficient evidence of a correct design; evaluate cross-user isolation, stale-context risk, and the quality effect of any truncation or summarisation used to preserve capacity.
```{python}
cache_record={"key_fields":["model","tokenizer","system prompt","authorisation context"],
              "ttl_minutes":15,"shared_across_users":False,"eviction":"least recently used",
              "pressure_action":"admit fewer long contexts"}
print(cache_record)
```
### Release candidates need a matched comparison
Before a release, define the baseline, candidate, eligible request population, allocation method, duration, outcomes, safety checks, and rollback rule. A candidate that receives only easy traffic cannot be compared with a baseline handling the full request distribution. A test in which users retry after a bad response may also contaminate the apparent completion or satisfaction rate. Preserve assignment and retry paths in the analysis.
Compare release candidates on task outcome, refusal and fallback behaviour, latency distribution, token and tool cost, incident rate, and user burden. A lower cost is not a general improvement if it comes from truncating more contexts or sending hard cases to a human without reporting that route. For workflows with material consequences, stage the release under a defined human-review and recovery boundary before broad exposure.
### Observability has a data-minimisation boundary
Logs help diagnose failures, evaluate drift, and investigate incidents. They can also retain sensitive prompts, documents, outputs, tool arguments, identifiers, and model-internal metadata. Decide which fields are necessary, which can be aggregated or redacted, how long raw traces are retained, who may query them, and how a user or organisation can request deletion where applicable. The retention policy should be tested against actual incident and debugging needs rather than assumed to be harmless.
Observability records need version links. A quality regression cannot be investigated if the trace lacks model, prompt, retrieval index, tool schema, policy, and deployment identifiers. At the same time, logging every raw input indefinitely creates its own exposure. The design problem is to retain enough information to reconstruct a failure under authorised review while limiting data collection and access.
### Drift is a hypothesis about a changed system
Dataset-shift evaluations show that predictive uncertainty can itself become unreliable when the data distribution changes [@ovadia2019]. A deployed AI system has several distributions and components that can change. Users may ask new questions, provide longer documents, switch languages, adopt a new interface, or retry differently. A retrieval corpus can be updated. A tool endpoint can alter its schema or availability. A safety policy can change what is refused. The model may remain fixed while the system outcome changes materially.
Start a drift investigation with a baseline window and a defined comparison window. Compare request characteristics, routing, model and prompt versions, retrieval and tool versions, latency components, output or outcome samples, and failure categories. Slice by task, language, user role, context length, and consequence where those dimensions are relevant. An aggregate metric can remain stable while one important workflow deteriorates.
When a change is observed, state competing explanations before selecting a remedy. A rise in hallucination reports may reflect a new knowledge domain, weaker retrieval, changed user expectations, or a reporting-interface change. A rise in latency may reflect traffic, cache pressure, model version, or an external service. The corrective action should follow the diagnosis: change a corpus, adjust routing, modify a prompt, add capacity, disable a tool, or roll back a release. Monitoring cannot decide this without a traceable configuration record.
```{python}
drift_compare={"baseline":{"long_context_share":.14,"p95_ms":820,"grounding_score":.76},
               "current":{"long_context_share":.31,"p95_ms":1260,"grounding_score":.68},
               "first_checks":["request length","retrieval index version","cache pressure","prompt version"]}
print(drift_compare)
```
### Service-level objectives specify an acceptable operating region
A service-level objective (SLO) translates a user or organisational need into a measurable target. It may specify availability, p95 latency for an eligible request class, successful completion rate, tool-action correctness, or a rate of independently checked grounded answers. The target must name its denominator and exclusions. “99% available” is incomplete unless it states which requests, regions, dependencies, and time window count.
SLOs involve trade-offs. A strict latency objective can require shorter contexts, lower output budgets, more hardware, a simpler model, or a fallback. A strict quality objective can reduce throughput or increase human review. Define an error budget and the action when it is exhausted: pause a feature release, add capacity, narrow eligibility, or roll back. This makes reliability a decision rule rather than a retrospective dashboard.
### Incidents require containment and learning
An incident can involve availability, data exposure, harmful output, unauthorised tool action, severe quality regression, or a combination. The immediate priority is containment: stop traffic, disable a tool, revoke a credential, isolate a corpus, or route requests to a safe fallback. The response should preserve authorised evidence, identify affected users or assets, and communicate status according to the consequence and policy.
Investigation then reconstructs the path. Which request or input class triggered the failure? Which model, prompt, policy, retrieval index, cache state, and tool version were active? Did a safeguard fail, or was the pathway outside its declared coverage? Corrective work should add a regression test that reproduces the failure under safe conditions. Closing an incident because a visible symptom disappeared does not demonstrate that the underlying pathway is controlled.
```{python}
incident={"signal":"unexpected tool calls","containment":"disable write scope","owner":"on-call lead",
          "evidence":"authorisation and request traces","correction":"validate structured arguments",
          "regression":"hostile retrieved-content test"}
print(incident)
```
### Cost accounting must follow the served request
Cost is influenced by prompt and output length, batch utilisation, cache hits, model routing, hardware reservation, tool calls, retries, monitoring, human review, and incident work. Report a distribution or request-class table rather than one average. A cheap average can hide a small group of requests that consumes most compute or a fallback path that moves cost to staff.
For a change proposal, estimate both marginal and total cost. Adding a larger model for difficult requests may have a modest marginal cost at low volume and a large capacity cost at high volume. Adding a cache can reduce compute while adding memory and data-governance obligations. The decision record should state the assumed traffic volume, quality requirement, and resource constraint so that another team can revisit it when the workload changes.
### The operational record connects the chapter's mechanisms
For each production version, retain a concise record of the model and tokenizer, prompt and policy configuration, routing and batching rules, cache policy, hardware and region, retrieval and tool versions, eligible traffic, SLOs, monitoring fields, incident contacts, rollback procedure, data-retention policy, and evaluation evidence. This extends the reporting discipline proposed for model documentation [@mitchell2019] to the configuration that actually serves users. It is the minimum information required to interpret a latency number, a quality metric, or an incident report.
The record also establishes the boundary for Chapter 49. Safe and responsible use depends on service permissions, data handling, monitoring, and recovery as well as model behaviour. A model can be well evaluated offline and still be deployed through an unsafe operational configuration.
### Test the service before and after deployment
Offline load tests should include the request-length and concurrency distributions expected in use, not only a batch of identical short prompts. Test cold starts, cache warm-up, long outputs, cancelled requests, dependency delays, retrieval failures, malformed tool responses, and traffic bursts. Confirm that metrics are emitted when the system degrades; an outage that also disables monitoring cannot be diagnosed from a normal dashboard.
Before broad release, run a staged test with the defined eligible population and fallback. After release, retain a small independent quality sample and compare it with the pre-release baseline. The objective is to detect a regression early, not to declare success because the service remained available. If the system changes a user-facing decision or action, include the human review and remedy path in the exercise.
### Bounded claims about a deployed system
A credible serving claim can state that a named configuration achieved a defined p95 latency, completion rate, and independently checked task outcome for an eligible traffic population during a specified period. It should list major exclusions, fallback routes, and the monitoring that would detect a changed condition. It does not establish the same result for a different prompt policy, data source, hardware region, traffic pattern, or consequence level without new evidence.
This bounded account makes operational work cumulative. Later deployments can compare configuration records and investigate changes rather than rebuilding an explanation from anecdote. It also leaves a clear handoff to safety and governance: performance goals do not determine whether a system has appropriate permissions, user protections, or accountability.
The final operational question is therefore practical: when a measured objective conflicts with another requirement, who is authorised to decide, what evidence will they use, and how will the resulting change be tested and communicated? A service that cannot answer those questions has not completed its deployment design.
The answer should be recorded before a crisis, reviewed after each material change, and available to the people who operate, audit, and rely on the service.
It should include the authority to pause traffic, notify affected users, preserve authorised evidence, and require a verified regression test before restoration.
```{python}
#| label: fig-monitoring-layers
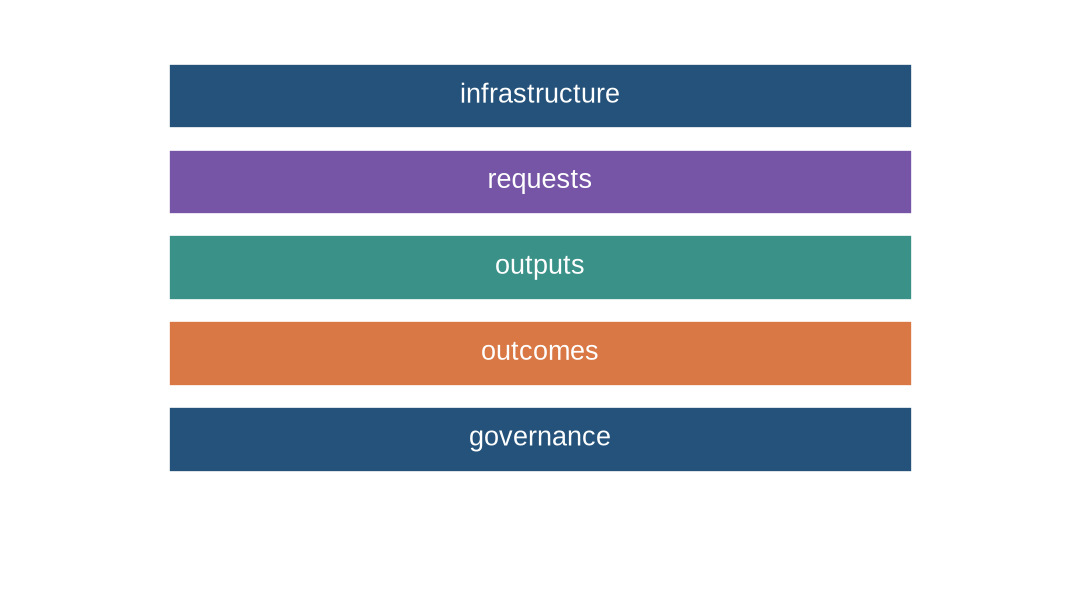
#| fig-cap: "Monitoring separates infrastructure, request, model-output, task-outcome, and governance signals because one layer cannot diagnose all failures."
#| fig-alt: "Five stacked bands label infrastructure, requests, outputs, outcomes, and governance records."
fig,ax=plt.subplots(figsize=(7,3.8));ax.axis("off")
for i,(l,c) in enumerate([("infrastructure","#24527a"),("requests","#7655a6"),("outputs","#3a9188"),("outcomes","#d97745"),("governance","#24527a")]):ax.add_patch(Rectangle((1,2.9-i*.55),5,.42,facecolor=c,edgecolor="white"));ax.text(3.5,3.11-i*.55,l,ha="center",va="center",color="white")
ax.set_xlim(0,7);ax.set_ylim(0,3.6);plt.show()
```
```{python}
#| label: fig-drift-slices
#| fig-cap: "Outcome monitoring should compare a stable reference slice with changed request populations rather than infer quality from aggregate traffic alone."
#| fig-alt: "A line chart shows stable reference performance and declining performance on a shifted traffic slice."
fig,ax=plt.subplots(figsize=(6.5,3.5));ax.plot([1,2,3,4],[.81,.80,.81,.80],label="reference");ax.plot([1,2,3,4],[.80,.77,.69,.63],label="shifted slice");ax.legend();ax.set_ylabel("task score");plt.tight_layout();plt.show()
```
## Exercises
1. Separate queue, prefill, decoding, and end-to-end latency.
2. Define throughput for a declared time window.
3. Explain one batching trade-off.
4. State one KV-cache memory driver.
5. Design a cache-eviction record.
6. Specify a rollout eligibility rule.
7. Define a rollback criterion.
8. List infrastructure monitoring signals.
9. List task-outcome monitoring signals.
10. Identify a logging privacy decision.
11. Construct a population-drift slice.
12. Explain why average latency can conceal tail failures.
13. Compare a fallback and retry policy.
14. Design a tool-failure alert.
15. Specify fields in a deployment record.
16. Identify the next chapter's safety question.
## Summary
Serving turns a model into a queueing, caching, and monitoring system with explicit rollout and recovery policies. Performance must be assessed in both service and outcome terms.
## Looking ahead
Operational controls can expose failures and limit their spread, but they do not define which threats a system must withstand or who is accountable when controls fail. [Chapter 49](49-safety-security-responsible-use.qmd) addresses those safety, security, data-handling, and governance decisions.